Why Expense Ratio Is the Only Number That Matters
May 02, 2026
10min read
fees
I was at a BBQ last summer, talking to a guy who works in commercial real estate. Smart guy, makes good money, knows his industry inside and out. Somehow we got on investing. He proudly told me his "guy" manages his portfolio, actively picking stocks, beating the market.
"What's the fee?" I asked. He didn't know. "What's the expense ratio on the funds?" Blank stare. I pulled out my phone, looked up one of his funds. 1.4% expense ratio, plus a 1% advisory fee. Total annual cost: 2.4%. The fund had underperformed the S&P 500 by 3% annually for the past five years.How Much Are Fees Costing You?
Compare expense ratios and see the long-term wealth destruction.
Compare FeesAll data stays in your browser — we never see it.
He was paying 2.4% to lose to the market. This is why I say expense ratio is the only number that actually matters.
The Predictive Power of Fees
Here's something wild: expense ratio is a better predictor of future fund performance than past returns, star ratings, manager tenure, or any other metric. Morningstar did a study on this. Low-cost funds outperform high-cost funds in virtually every category, over every time period.
Why? Simple math. Every dollar you pay in fees is a dollar that doesn't compound for you. A fund earning 8% gross with 1.5% fees nets 6.5%. A fund earning 7.5% gross with 0.05% fees nets 7.45%. The cheaper fund with lower gross returns still wins.
The Real Cost Over Time
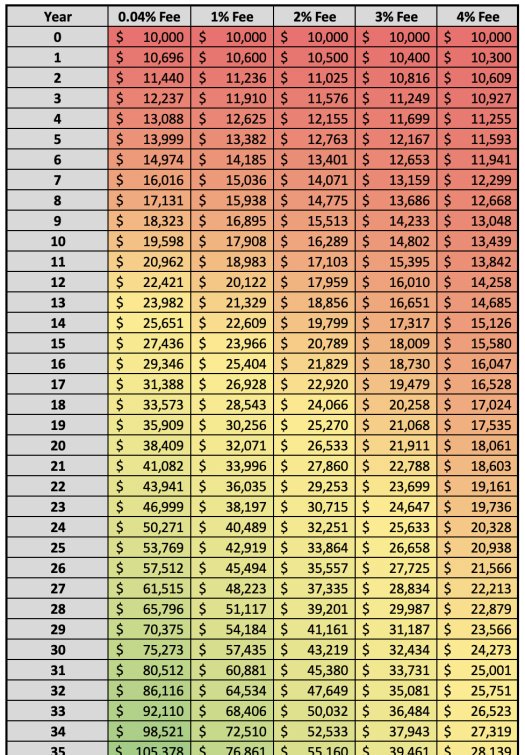
Let's use my BBQ friend's numbers. $300,000 portfolio, 2.4% total fees, 30 years. How much does he pay in fees? Roughly $420,000. Four hundred twenty thousand dollars. That's a paid-off house in Denver. Gone to fees.
Same portfolio at 0.1% total fees (Vanguard index funds, no advisor): about $22,000 in fees over 30 years. The difference: $398,000. That's not a typo. That's what 2.3% in extra fees costs you.
I showed him this calculation on a napkin. He fired his advisor the next week and moved everything to a three-fund index portfolio. Total cost: 0.06%. He's now beating his old "market-beating" strategy by simply not paying for it.
What You Should Pay
For a simple stock/bond portfolio using index funds: 0.1% or less. VTI at 0.03%, VXUS at 0.08%, BND at 0.03%. Three funds, total cost around 0.05%. Global diversification for basically nothing.
Target-date funds: 0.1-0.15%. Anything over 0.5% is too expensive unless there's a very specific reason.
The fee comparison tool on this site lets you model exactly this. Plug in two scenarios and see the difference over decades. It might be the most eye-opening calculation you do this year.
The Active Management Myth
"But my active manager beats the market!" No, they don't. At least not consistently enough to matter. S&P SPIVA data shows that over 15-year periods, about 90% of active managers fail to beat their benchmark index. After fees, it's even worse.
The few managers who do beat the market are nearly impossible to identify in advance. Yesterday's winner is often tomorrow's loser. Hot funds attract assets, which makes them harder to manage, which leads to underperformance. It's a cycle.
I spent 14 years analyzing funds professionally. I can count on one hand the number of active managers I believe have genuine skill. And even they have bad years. For individual investors, indexing is the rational choice.
Hidden Costs Beyond the Expense Ratio
Expense ratios don't capture everything. Mutual funds have trading costs that aren't included in the stated ratio. High turnover funds incur more transaction costs and tax inefficiency. Cash drag (funds holding cash for redemptions) reduces returns.
A fund with 0.75% expense ratio and 100% annual turnover probably costs closer to 1.0% all-in. An index fund with 0.04% expense ratio and 3% turnover costs basically 0.04%. The gap is even wider than it appears.
Brokerage commissions for fund trades? Mostly gone thanks to zero-commission brokers. Bid-ask spreads? Still real, but minimal for large ETFs. The expense ratio is the big one, and it's the one you can control.
The Bottom Line
I don't care how good a fund's marketing is. I don't care about the manager's pedigree or the fancy office on Wall Street. I care about one number: how much of my return do I get to keep?
At 0.05%, you keep almost all of it. At 1.5%, you give away a third of your potential gains to fees. Over decades, that's the difference between retiring at 60 and retiring at 67. Use the fee comparison tool on this site. See it for yourself. Then switch to low-cost index funds and never look back.
Final Thoughts
Look, I'm just a guy in Denver with a spreadsheet habit and a dog who sheds too much. I don't have a crystal ball. I can't predict where the market is going next month or next year. Nobody can, despite what they might tell you on TV.
What I can do is show you the math. The numbers don't lie, even when we want them to. Compound interest works. Fees matter. Diversification protects you. Time is your greatest asset if you're young, and your greatest concern if you're not.
The tools on this site are free because I believe everyone deserves access to honest financial analysis. No sales pitch, no hidden agenda, no commissions. Just data and my occasionally sarcastic commentary.
If you take one thing from this article, let it be this: small decisions made consistently beat perfect decisions made occasionally. Start where you are. Use what you have. Do what you can. The rest is just compounding.
What I Learned from 14 Years in the Industry
After analyzing thousands of portfolios at three different firms here in Colorado, I've developed a few principles that guide everything I write on this site. These aren't fancy theories from textbooks. They're observations from real people with real money making real mistakes.
First, complexity is the enemy of execution. The more complicated your investment strategy, the less likely you are to follow it consistently. I've seen PhDs in mathematics fail at personal finance because they couldn't stop tinkering. Meanwhile, my neighbor who barely graduated high school built a $2 million portfolio using nothing but a target-date fund and automatic contributions. Simplicity wins because simplicity is sustainable.
Second, behavior matters more than knowledge. Everyone knows they should buy low and sell high. But when the market drops 30%, emotions take over. I've watched incredibly smart people panic-sell at the bottom and miss the recovery. The best investment strategy is the one you'll actually stick with when things get ugly. That's usually the boring strategy.
Third, fees are the only thing you can control. You can't control market returns. You can't control inflation. You can't control what the Federal Reserve does. But you can absolutely control how much you pay in investment fees. And over decades, that control is worth hundreds of thousands of dollars.
Cooper is scratching at the door now, which means it's time for our afternoon walk along the South Platte. Before I go, let me leave you with this: the best financial decision you can make today is the one you actually follow through on. Not the perfect theoretical strategy. The one you implement. The one you stick with. The one that becomes a habit.
That's just my take. I'm a guy with a spreadsheet and a shedding dog. Do your own homework. And if you found this helpful, try one of the calculators on this site. The numbers might surprise you.
How Fees Compound Against You
Most people understand that fees reduce returns. But few grasp how dramatically fees compound over time. It's not a linear relationship. A 1% fee doesn't reduce your final balance by 1%. It reduces it by roughly 25-30% over a 30-year period.
Here's why. Every dollar paid in fees is a dollar that can't compound. In year one, a 1% fee on $100,000 is $1,000. That $1,000 would have grown to $7,600 over 30 years at 7%. So the year-one fee actually cost you $7,600 in lost growth. And it gets worse every year as your balance grows.
I built the fee comparison calculator specifically to show this compounding effect. The visual chart makes it obvious: two lines starting together, diverging slowly at first, then dramatically. After 30 years, the gap is staggering. That's not marketing, that's math.
The worst part? Most investors never see this. Fees get deducted quietly, behind the scenes. Your statement shows returns net of fees, so you don't feel the pain directly. It's like a slow leak in a tire. Everything seems fine until it isn't.
Tools That Help
I built several free calculators on this site specifically to help with the concepts discussed in this article. They're all browser-based, no signup required, and your data never leaves your computer.
Try plugging in your actual numbers. Adjust the assumptions. See what happens when you change the time horizon or the rate of return. The best financial decisions are informed ones, and these tools give you the information you need.
If you find a bug or have a suggestion for a new calculator, email me at privacy@investcomparetool.org. I read every message, though it might take me a week or two to respond. Cooper keeps me busy.
M
About Marcus Thornton
Independent investment researcher based in Denver, Colorado. Former portfolio analyst with 14 years of experience. CFA charterholder. When not crunching numbers, you'll find him skiing the Rockies or fly-fishing the South Platte with his dog Cooper.
Your friend Marcus