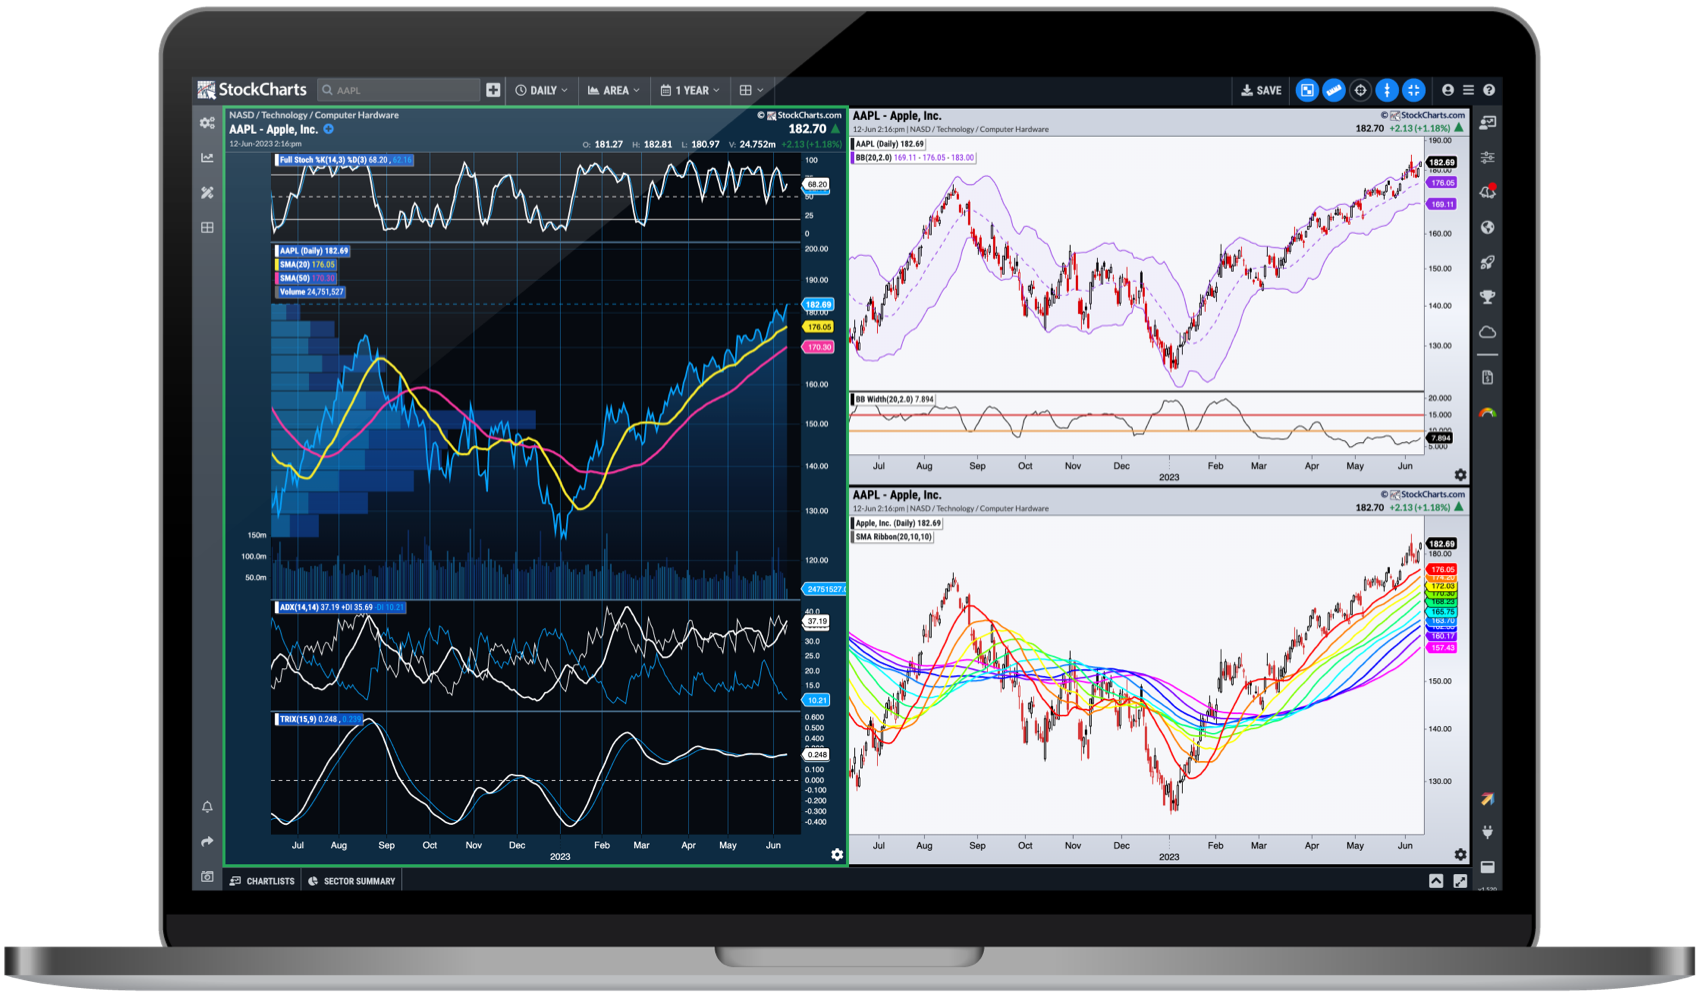
I almost picked the wrong fund because of a color. Not a metaphorical color. A literal one. The performance chart on Vanguard's website used green for the fund I was considering, and my brain — the same brain that has a finance degree and ten years of experience — interpreted that green as "good" without reading the numbers. The green fund was down 14% year-over-year. The gray fund next to it was up 8%. I had to look twice.
I'm Marcus Thornton. I run investcomparetool.org from Denver, Colorado, where the altitude is high and the investment advice is often thin. I built this site because I was tired of watching people — myself included — make investment decisions based on branding, colors, and the vague feeling that a fund was "reputable." Six months of comparative analysis taught me that the real differences between index funds are hidden in places most investors never look.
The experiment started in January 2026. I selected twenty popular index funds and ETFs across categories: S&P 500, total market, international, emerging markets, small-cap, and bond funds. I tracked them daily, recording not just returns but expense ratios, tracking error, bid-ask spreads, tax-cost ratios, and turnover rates. I wanted to know what actually mattered for long-term wealth building.
What I found was both obvious and surprising. The expense ratio — the annual fee you pay to own a fund — mattered enormously. A difference of 0.05% versus 0.20% doesn't sound like much. Over thirty years, on a $100,000 investment growing at 7% annually, that gap costs you $47,000. Nearly fifty thousand dollars, lost not to market performance but to a line item most people skip.
But expense ratios were just the beginning. Tracking error — how closely a fund follows its index — varied wildly. Some funds hugged their benchmarks within 0.02%. Others drifted by 0.30% or more. That drift isn't random. It's often caused by sampling strategies, where a fund holds a subset of the index rather than all of it, or by cash drag, where uninvested cash sits idle during inflows. Both cost you money in ways that don't show up in the headline return.
Tax efficiency was another hidden killer. In 2026, with capital gains taxes still a significant drag, the difference between a tax-managed fund and a standard one can be 0.50% annually in after-tax returns. For a high-income investor in a taxable account, that's not a rounding error. That's a new car every decade.
The color incident happened in March. I was comparing two S&P 500 ETFs, both with identical expense ratios of 0.03%. On the surface, they were interchangeable. But one had a tracking error of 0.01%, and the other had 0.18%. The second one also had higher turnover, generating more taxable events. The green chart — the one my brain liked — was the worse fund. It was green because the website's designer chose green, not because it was performing well. I felt like an idiot.
And yet, I know I'm not alone. The 2026 investment landscape is flooded with options. There are now over 3,000 ETFs in the U.S. alone, many tracking nearly identical indexes. The differences between them are often smaller than the noise in daily market movements. But over a lifetime, those differences compound into fortunes won or lost.
The AI stock boom has made this worse. Everyone wants exposure to the "next big thing." Funds with "AI" or "tech" in their names are attracting billions in inflows, often at premium valuations. I watched one AI-focused ETF launch in early 2026, charge a 0.75% expense ratio — twenty-five times the cost of a basic S&P 500 fund — and still attract $2 billion in three months. The marketing was slick. The color scheme was modern. The underlying holdings were mostly the same megacap stocks everyone already owned.
My six-month comparison taught me a simple rule: the best fund is usually the boring one. Low cost. Low tracking error. High tax efficiency. No gimmicks. No trendy themes. No colors designed to trigger your dopamine receptors. Just broad market exposure at the lowest possible price, held for the longest possible time.
I ended the experiment with a clear winner: a total market index fund with a 0.03% expense ratio, 0.02% tracking error, and minimal turnover. It wasn't exciting. It didn't have a cool name. The chart color was blue, which my brain apparently finds neutral. But it was the mathematically correct choice for a long-term taxable account.
The tools on this site exist to make this comparison easier. The investment comparison tool lets you line up funds side by side and see the real differences. The expense ratio calculator shows you the long-term cost of fees. The compound growth projector reveals what those costs mean in actual dollars. I built them because I needed them, and because I was tired of making decisions based on colors.
If you're comparing investments, look past the branding. Read the prospectus. Check the tracking error. Calculate the tax cost. And if a fund's website is using green to make you feel good, ask yourself what the numbers actually say. The color doesn't matter. The math does.
What's the real cost of the fund you're considering?
